Using JSpecView and JMol
|
|---|
|
Now we will use these JSpecView and JMol applets to answer the following questions about this NMR spectrum. Don't hesitate to ask Prof. Homans or a demonstrator if necessary.
|
|
Question 31: In Hexane, how may atoms correspond to the Hydrogen-1 NMR (HNMR) peak at 0.9 PPM ?
(Note PPM is the horizontal scale of the JSpecView applet).
|
|
|
|
Your Answer: YourAnswer Mark
Correct Answer: 6 Hydrogen atoms.
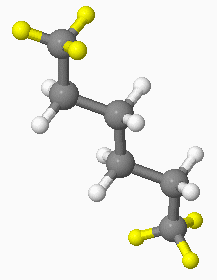
By clicking on the JSpecView applet at 0.9 PPM, three hydrogen atoms at each end of the hexane molecule (so six hydrogen atoms in total) will be highlighted in yellow, as shown below:

|
|
|
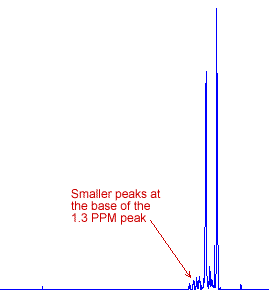
Question 32: In the Hydrogen-1 NMR (HNMR) spectrum of Hexane, why is the peak at 0.9 PPM taller than the peak at 1.3 PPM ?
|
|
|
|
Your Answer: YourAnswer Mark
Correct Answer: the 1.3 PPM peak has a greater area under it.
The intensity of any NMR peak is proportional to the area under the peak, so a short wide peak can have greater area than a tall narrow peak. The peak at 1.3 PPM corresponds to eight hydrogen atoms, which is more than the six atoms of the 0.9 PPM peak. Overall, the 1.3 PPM peak has a greater area under it, as it has a set of smaller peaks around it due to spin-spin coupling which you will learn about in the next webpage.

|
|
|
Question 33: On the Hydrogen-1 NMR of Hexane, there are small peaks at 0.0 PPM and at 7.3 PPM. What do you think the small peak at 0.0 PPM is due to ?
|
|
|
|
Your Answer: YourAnswer Mark
Correct Answer: a calibration peak.
To accurately determine the zero position on the resulting NMR spectrum, a small quantity of a reference compound, such as Tetramethylsilane (TMS), Si(CH3)4 is usually added. Because all twelve hydrogen atoms in a tetramethylsilane molecule are equivalent, the 1H NMR spectrum of TMS consists of a single peak. The chemical shift of this singlet is assigned as 0.0 in the NMR spectrum, and all the other chemical shifts are determined relative to it.
The other small peak at 7.3 PPM is probably due to the solvent or an impurity. The solvent CDCl3 has a residual peak at 7.26 PPM, so this is the likely cause of this peak.
Common 1H NMR Impurities.
|
|
|
Question 34: How many peaks are visible in this Carbon-13 NMR (CNMR) spectrum of Hexane ?
|
|
|
|
Your Answer: YourAnswer Mark
Correct Answer: 4 peaks.
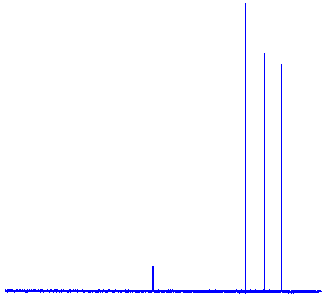
Clicking on the "CNMR (Carbon-13 NMR) radio-button will display the Carbon-13 NMR spectrum" for Hexane. As shown below, this has 4 peaks. However, hexane has 6 carbon atoms, and the carbon atoms at each end (ie. C#1 and C#6) experience the same shielding, the carbon atoms one-position in from each end (ie. C'#2 and C#5) experience the same conditions, and the central two carbons (ie. C#3 and C#4) experience same conditions. So in the spectrum, the three tall peaks on the right correspond to the three pairs of carbon atoms, and the smaller peak on the left would be a peak due to either a calibration reference compound or the solvent.

|