|
|
|---|
|
This exercise will give you the opportunity to use the SpinWorks program to process NMR data. SpinWorks enables easy basic off-line processing of 1D and 2D NMR data (including routine research work in organic chemistry) and also simulation of NMR spectra. It is developed by Kirk Marat of University of Manitoba and runs on Windows 98, NT, XP and 2000, Linux using WINE, and Macintosh using SoftWindows.
|
|
|
|---|
To start SpinWorks:
- Click the Windows "Start" button (botton left of screen)
- Select "All Programs"
- then select "SpinWorks".
|
|
|
|---|
|
As shown on the previous webpage (NMR Java animation: 'Radio Signal' and 'Detection' buttons), an NMR machine creates a brief pulse of radio energy to excite the NMR active nuclei (usually 1H or 13C nuclei). The nuclear spins then decay back to an equilibrium state by releasing radio-frequency energy. This is called free induction decay or FID.
To open a 1D NMR fid data file:
- Click the
 icon at the top-left on the SpinWorks toolbar, (or alternatively use the menu option: "File" ⇒ "Open...") icon at the top-left on the SpinWorks toolbar, (or alternatively use the menu option: "File" ⇒ "Open...")
- Choose the subdirectory: "strychnine"
- then subdirectory: "1"
- Select file named: fid as shown below:
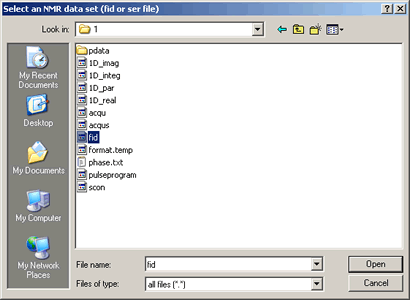
This will display the FID data as shown below:
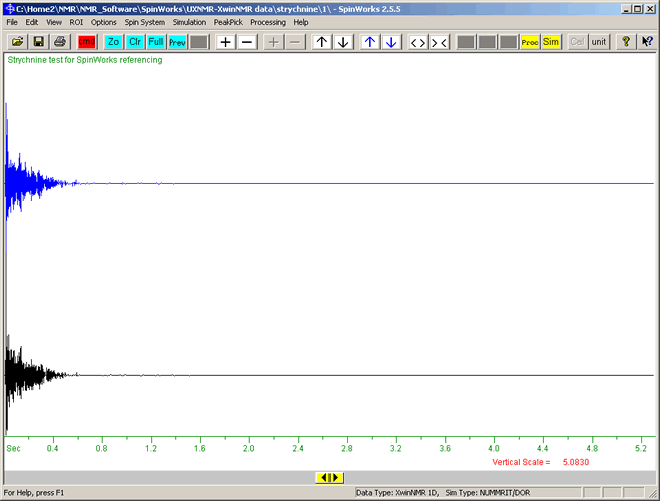
This shows the decay in signal intensity (vertical axis) versus time (horizontal axis, t = 0 on left). The black plot is the experimental spectrum, and the blue is the calculated spectrum.
If the graph does not appear as above, this may be because:
- To save time, SpinWorks can remember the processing performed previously on any dataset file. So after this fid file is transformed to frequency data, it will appear as transformed data when opened in future. This 'remembered' data is stored by Spinworks in separate files such as: 1D_imag, 1D_par, 1D_real, 1D_integ. If you wish to disable this, then in the menu item Options ⇒ Set Preferences and Start-up options..., uncheck the 'Auto Save' or 'Auto Load' boxes.
- The data format may be setup incorrectly. To check the data settings in SpinWorks are correct: Click menu Options ⇒ Data Format… ⇒ Bruker (UXNMR/XwinNMR). Then click Options ⇒ Data Format… ⇒ 1D. Then open the fid file again.
|
|
|
|---|
An FID (free induction decay) shows signal versus time, whereas an NMR spectrum shows signal versus frequency. Frequency is the inverse of time (ie. Frequency = 1/Time), so the FID can be converted to an NMR spectrum using Fourier transformation (FT).
To convert this FID graph to the the NMR spectrum:
- Click the Processing menu,
- Select em+ft.
This applies a window function (Exponential multiplication using Lorentzianing broadening) followed by Fourier transformation.
(Alternatively the "Proc"  toolbar button could be used to perform this processing.) toolbar button could be used to perform this processing.)
The result should be similar to the following spectrum:
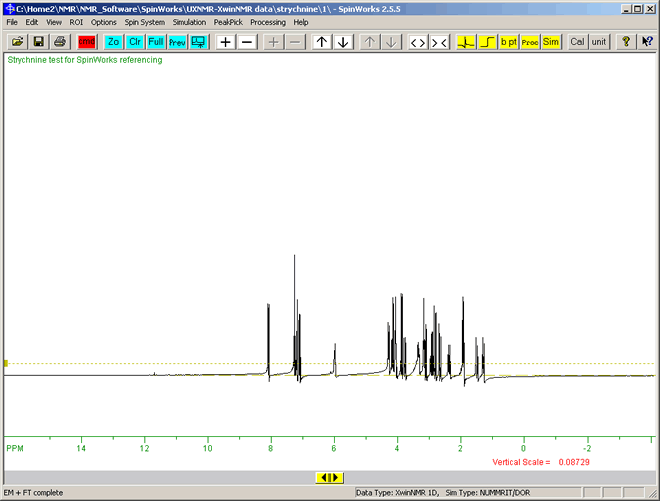
This is the 1D proton NMR spectrum for Strychnine, the structure of which can be determined with NMR. The solvent is deuterated chloroform, CDCl3 (the Hydrogen in CHCl3 replaced by Deuterium). Tetramethyl silane, Si(CH3)4 is usually used as the internal standard, which is set as zero on the hozizontal scale.
|
|
|
|---|
To look at the spectrum in more detail, you can:
- Move the spectrum left and right by dragging (clicking and holding-down the left mouse button) on the Horizontal slider
 at the bottom of the screen. at the bottom of the screen.
- Expand the horizontal scale by clicking the Expand button
 . .
- Squeeze (contract) the horizontal scale by clicking the Squeeze button
 . .
- Zoom in on a region of the spectrum by:
- Clicking to the left of the region to be zoomed (a red vertical line will appear at the mouse cursor position).
- Clicking a second time at the right of the region to be zoomed, which will produce another vertical red line. These two red lines mark the boundary of the area to zoom in on.
- Clicking the Zoom button
 (or click the middle mouse button.) (or click the middle mouse button.)
- You can repeat this to zoom in closer.
- Note: If you position the first two red lines incorrectly, then a third click will clear them then you can try again, or click the 'Clr' markers button
 . .
- To position the red line markers more precisely, the movable tracking cursor can be turned on (or off), by either:
- Click Options ⇒ Tracking Cursor... ⇒ Tracking Cursor On
- Double-click anywhere on the spectrum
- Press "t" on the keyboard.
- To return to the previous width, click the 'Prev' button
 . .
- To zoom-out to full width, click the 'Full' button
 . .
|
|
|
|---|
- To change the vertical scale there are three methods:
- Roll the middle mouse button (scroll wheel) back and forth,
- Press the up/down arrows on your keyboard,
- Click on the Increase
 and Decrease
  vertical scale buttons. vertical scale buttons.
- To move the graph vertically click the shift up
 and shift down and shift down  buttons. buttons.
|
|
|
|---|
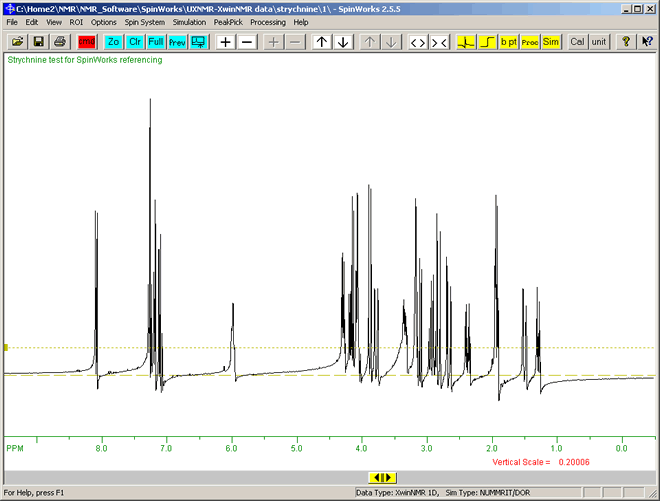
To view the base-line irregularity in more detail:
- Use the mouse-scroll wheel or the keyboard up-arrow key, or increase vertical scale button
 to vertically enlarge the peaks. to vertically enlarge the peaks.
- The menu option "View" ⇒ "Set Fixed Limits" ⇒ "9 to -0.5 ppm (proton syurvey)" to increase the horizonal scale, as this is a proton (1H) spectrum.
- The view should be similar to the following:
|
|
|
|---|
|
The baseline of the spectrum should be flat and symmetrical on either side of each peak, as shown in the right-hand image below. If the baseline on either side of peaks is asymmetrical, as shown in the left spectrum below where it is low on the left and high on the right, then the spectrum needs phasing.
(More detail: Fourier Transformation produces complex (real + imaginary) numbers. Phasing combines the real and imaginary numbers in their correct ratio.)
We will first use SpinWork's automatic phase correction, then manually further improve the phasing:
- From the menu, select: "Processing" ⇒ "Automatic Phase Correction". This will partly improve the phasing.
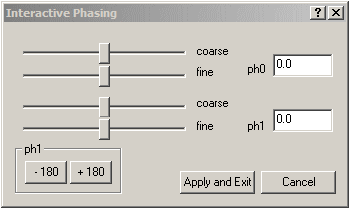
- To manually improve this phasing, click the Phasing button
 on the toolbar. This will display the "Interactive phasing" dialogue as shown below: on the toolbar. This will display the "Interactive phasing" dialogue as shown below:
Note that the zero-order reference point (tallest peak.), here at 7.2 ppm, is marked with a vertical green line:
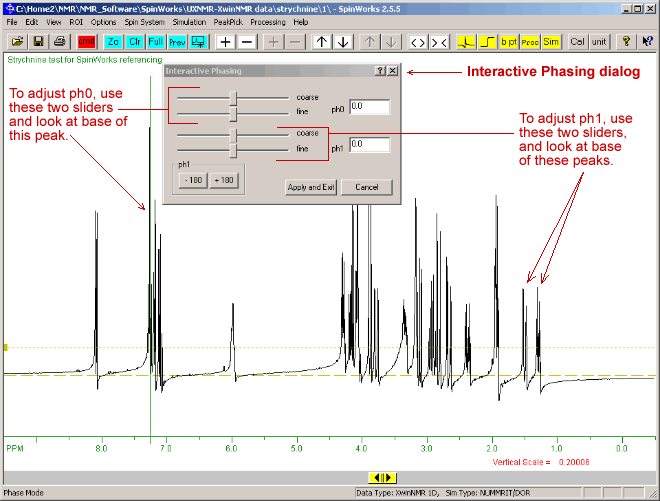
Correct the zero order phase (or ph0 which is frequency-independent) by moving the top course and fine sliders to give a properly phased upright peak at the reference mark (green vertical line), so that the baseline at this peak is roughly symetrical with no baseline dips at either side. Adjust the first order (or ph1 which is frequency-dependant), using the lower coarse and fine sliders to phase the peaks furthest from the vertical green reference line, (eg: at 1.5 PPM) Click the"Apply and Exit" button on this "Interactive Phasing" dialogue. - You can repeat this phase correction if you wish to further improve it. It is often a compromise between a phase setting that works well for several peaks, but not perfectly for all peaks.
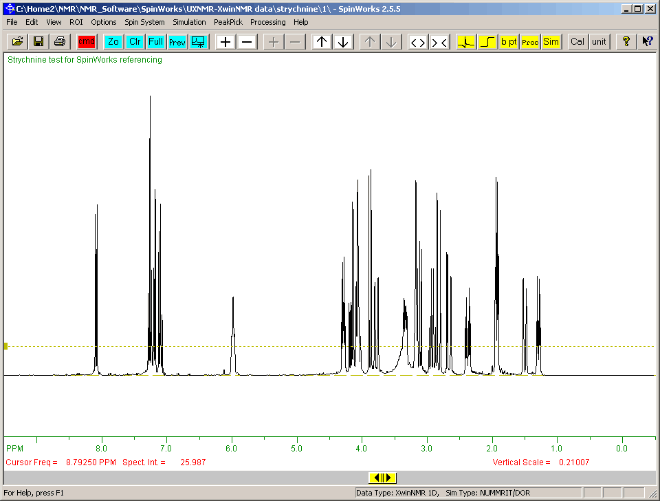
The final spectrum should look like the one below:
|
|
Now we will use these Spinwork controls to answer the following questions about this NMR spectrum. Don't hesitate to ask Prof. Homans or a demonstrator if necessary.
|
|
Question 41: How many NMR peaks are there between 2.6 and 3.0 PPM ?
(Note PPM is the horizontal green scale. The 'Unit' button can be used to toggle between PPM and Hz. The current units are shown in green at the left end of the green horizontal scale.)
|
|
|
|
Your Answer: YourAnswer Mark
Correct Answer: 10 peaks.
On the initial fully zoomed-out view it is difficult to count the individual peaks. However by zooming in to the region 2.6 to 3.0, ten peaks can be seen at 2.63, 2.64, 2.68, 2.70, 2.79, 2.84, 2.87, 2.90, 2.93 and 2.97 PPM, as shown in the image below.
(Remember: To zoom in: click with the left mouse button at 3.0 PPM on the green horizontal scale, then at 2.6 approximately, then click the Zoom button. Note that horizontal scale values decrease going right-wards.)
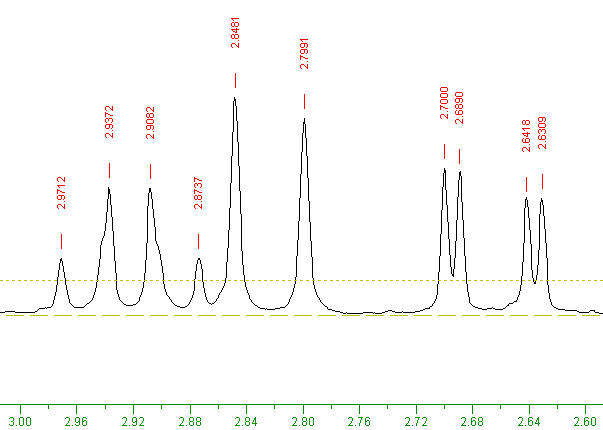
The menu item: "PickPeak" ⇒ "Pick peaks and Append to list" can be used to highlight all peaks in the current view and above the brown horizontal finely-dotted-line. (This horizontal finely dotted-line line can be moved up or down by dragging the small square visible at its left side.)
The menu item: "PickPeak" ⇒ "List" will display the picked peaks in a Notepad text-editor window. (If the pick list doesn't display in Notepad, then on SpinWorks menu select: "Edit" ⇒ "Set Preferences and Start-up Options..." and a "Edit Start-up Defaults" dialog box should appear. In its "External Simulation Modules" section, set: Default Scratch Folder:" to a directory which you have permissions to write to, such as "C:\Temp")
|
|
|
Question 42: How many NMR doublets and triplets are there between 2.32 and 2.72 PPM ?
|
|
|
|
Your Answer: YourAnswer Mark
Correct Answer: 2 doublets and 2 triplets.
By zooming in to the region 2.32 to 2.72 PPM, two doublets and two triplets, as shown below:
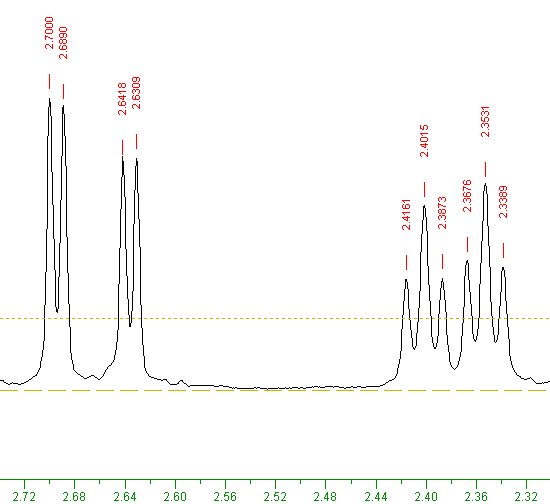
As the two triplets on the right are close together, they can be termed a doublet of triplets.
|
|
|
Question 43: What spin-spin coupling pattern appears between 2.86 and 3.0 PPM ?
|
|
|
|
Your Answer: YourAnswer Mark
Correct Answer: a quartet.
By zooming in to the region 2.86 to 3.0 PPM, a quartet can be seen, as shown below:
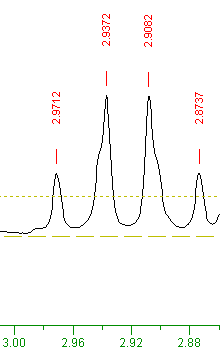
When one proton's spin is split by three identical protons, the resulting NMR peaks form a quartet, each peak having relative intensities of 1:3:3:1. The different simple multiplet shapes are shown below, where 'n' is the number of nearby identical protons:

When a proton is coupled to two different protons, then the coupling constants are likely to be different, so instead of a triplet, a doublet of doublets will be seen:

Images and description from Wikipedia.org.
|
|
|
|
|---|
|
Picking of peaks was mentioned briefly in the answer to question (A) above. We will practice picking peaks now.
Note:
- Zooming-in or Expanding the horizontal scale can be used to reduce the number of peaks picked, and make small or close-together peaks more visible.
- Only peaks in region of the NMR spectrum currently displayed will be picked.
- Only peaks will be picked that are taller than the threshold intensity bar (the finely-dotted brown horizontal line).
- The initial pick peaks display units will be PPM, no matter what the horizontal scale has been set to by the Unit button.
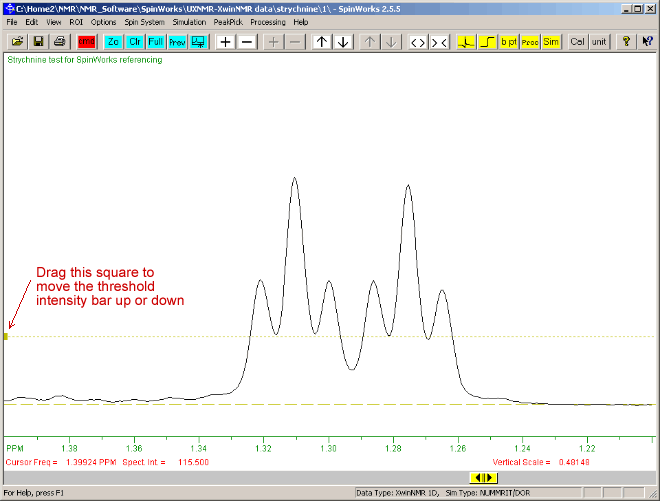
- Select menu option: "PeakPick" ⇒ "Pick Peaks and Append to List" This should display a message giving the number of peaks picked, then should display the frequency in red figures above each peak.
- To display a list of the selected peaks use: "PeakPick" ⇒ "List", which will display in a Notepad text editor the frequency and intensity of all selected peaks. (Click the X in top right of this Notepad window to close it and return to SpinWorks.)
- To optionally unselect the peaks currently displayed, you can use: "PeakPick" ⇒ "Clear Peaks in Region", or to unselect all peaks you can use: "PeakPick" ⇒ "Clear Peak List"
|
|
|
Question 44: What is the frequency in Hz of the highest frequency peak in this NMR spectrum ?
|
|
|
|
Your Answer: YourAnswer Mark
Correct Answer: 379.653 Hz.
The peaks you picked above should display as:
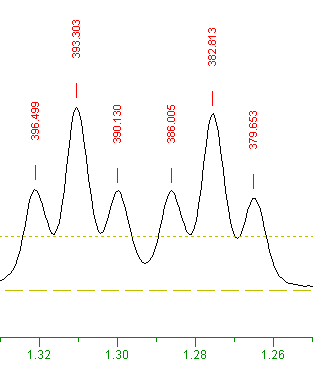
Use the horizontal slider  to look for peaks to the right (ie. higher frequency) of this position, you can see that there are no peaks with higher frequency than this. So the frequency in Hz of the highest frequency peak is 379.653 Hz. to look for peaks to the right (ie. higher frequency) of this position, you can see that there are no peaks with higher frequency than this. So the frequency in Hz of the highest frequency peak is 379.653 Hz.
The menu opion: "PeakPick" ⇒ "List", would also display in a Notepad the detailed list of selected peaks.
|
|
|
Question 45: What is the absolute intensity of this highest frequency peak at 379.653 Hz in this NMR spectrum ?
|
|
|
|
Your Answer: YourAnswer Mark
Correct Answer: 3457.903000.
The menu opion: "PeakPick" ⇒ "List", display in a Notepad a list of frequencies and intensities for the currently selected peaks:
 SpinWorks peak list for:
 ...\SpinWorks\UXNMR-XwinNMR data\strychnine\1\

 peak #   freq. (Hz)    freq. (ppm)  intensity  intensity(absolute)
    1       396.499       1.3211     0.184576       3769.402000
    2       393.303       1.3104     0.335931       6860.368000
    3       390.130       1.2999     0.180608       3688.367000
    4       386.005       1.2861     0.180682       3689.886000
    5       382.813       1.2755     0.320515       6545.558000
    6       379.653       1.2650     0.169323       3457.903000
|
The absolute intensity of the paek at 379.653 Hz is: 3457.903000
An alternative way to find the intensity of any peak, is by moving the mouse over it, and the "Spect. Int. =" value will be continuously updated in red text at the lower right of the SpinWorks display.
|
|
|
|
|---|
|
It is usually necessary to Calibrate the NMR Spectrum, by manually setting the frequency of the known reference standard peak, such as TMS, Tetramethyl silane, Si(CH3)4, the usually, which is set as zero on the horizontal scale. This would be done by selecting the reference peak with the mouse, then clicking the Calibration button  . .
|
|
|
|---|
|
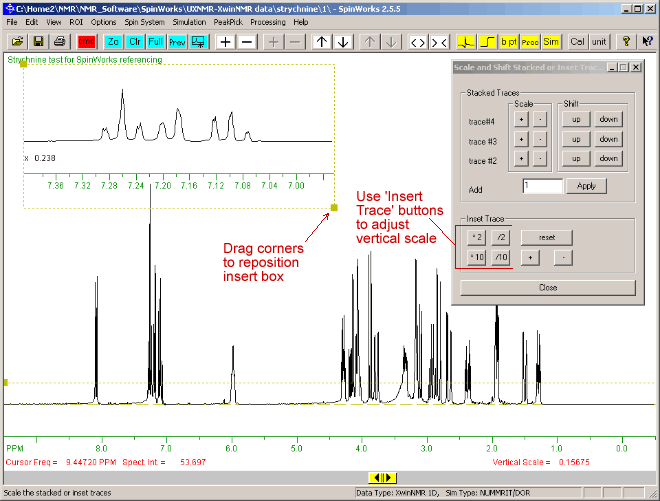
A region of the NMR spectrum can be displayed in a small inset box, as follows:.
- Use the menu option "View" ⇒ "Set Fixed Limits" ⇒ "9 to -0.5 ppm (proton syurvey)" to view this full proton spectrum.
- Click with left-mouse button at the left and right of the desired region of the NMR spectrum, so that two vertical red lines bound the desired region.
- Click the "Copy graph to insert box" button
 . .
- The size of this inset box can be adjusted by dragging the squares at it's corners with the mouse.
- The vertical scale of the spectrum in the inset box can be adjusted using the *2 /2 *10 /10 buttons on the "Insert Trace" section of the "Scale or Shift Stacked or Inset Trace" dialog box.
The display should be similar to that below:
- The "Scale or Shift Stacked or Inset Trace" dialog box can be closed by clicking its "Close" button, or the X at its top-right.
- To redisplay the "Scale or Shift Stacked or Inset Trace" dialog box, use menu option: "View" ⇒ "Scale/Shift Stacked or Inset Traces...".
- The Inset box can be hidden or made to reappear using menu option: "View" ⇒ "Show Inset Box". Try it: make the insert box disappear then make it appear again.
|
|
|
|---|
|
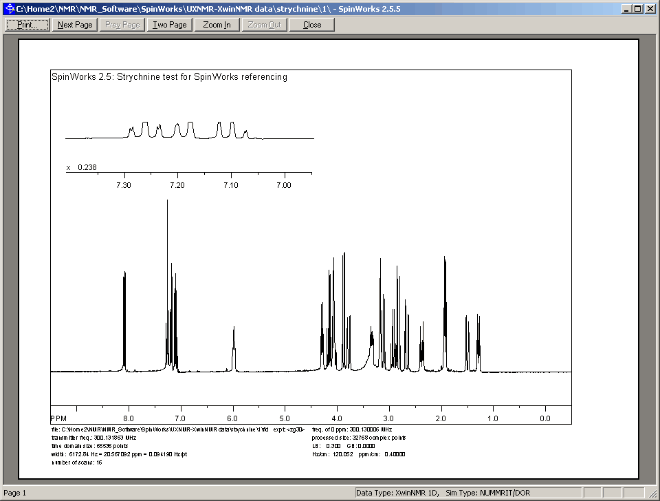
The currently displayed region of the NMR spectrum can be printed as follows:
- Select menu option: "Edit" ⇒ "Plot Title...", and enter a suitable title, such as: "Proton NMR Spectrum for Strychnine". (If you include your Name or Student ID in the title then you will be able to find your print-out more easily on the printer.) Then click the "OK" button on the "Plot Tiitle Dialog" window.
- Select menu option: "File" ⇒ "Print Preview", which should display a preview similar to that shown below:
- If satisfied with the preview, then click the "Print" button at the top of the Preview window,
- From the "Print" dialog, select the correct printer, then click the "OK" button.
|
|
|
|---|
|
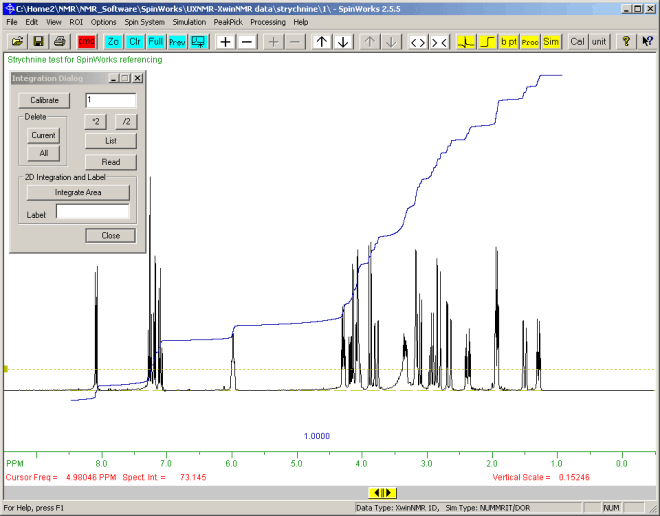
All or part of the NMR spectrum can be integrated as follows:
- Click the Integration
 tool-bar button, to display the "Integration Dialog" tool-bar button, to display the "Integration Dialog"
To integrate the full width of the spectrum:
- Click with left-mouse button at very left of the spectrum (a red vertical line will appear),
- Click to the very right of the spectrum. A blue integration line should appear.
- Use the "*2" and "/2" button to reduce the vertical scale of the integration so that the line continues to rise going right-wards, as shown below:
To be contined perhaps by asking about proportions of the different chemical shifts in the spectrum....
|
For the actual 1H spectrum to molecule assignment, see: http://rmn.iqfr.csic.es/guide/tutorials/specdata/spectra/str_zg.html
|
|
|---|
We will now look at a two-dimnsional COSY spectrum for Strychine, which priovides more information about the molecular structure than is available from 1D NMR.
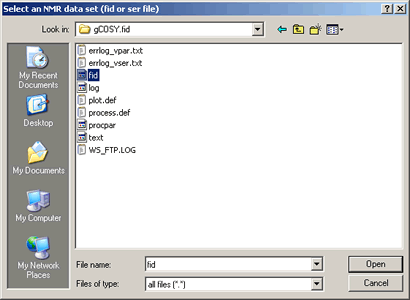
To open the 2D NMR fid data file:
- Click the
 icon at the top-left on the SpinWorks toolbar, (or alternatively use the menu option: "File" ⇒ "Open...") icon at the top-left on the SpinWorks toolbar, (or alternatively use the menu option: "File" ⇒ "Open...")
- Choose the subdirectory: "SampleData"
- then subdirectory: "sample_Varian_2D"
- then subdirectory: "gCOSY.fid"
- Select file named: fid as shown below:
- A box will appear with the warning: "This appears to be 2D data, change to 2D mode?". Click the "Yes" button to accept 2D.
- This will display the FID data as shown below:
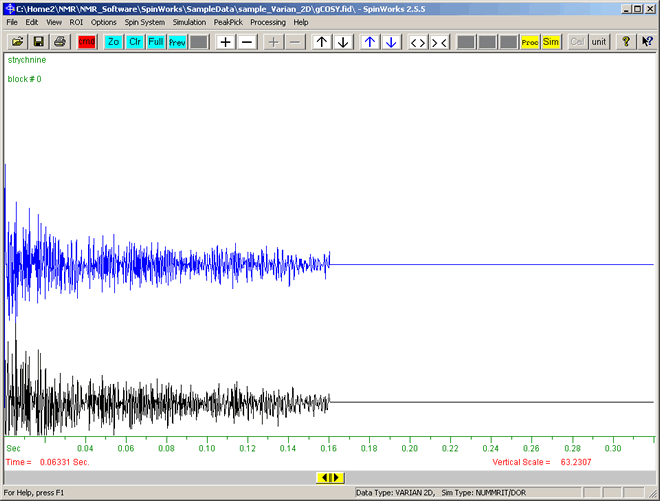
This shows the decay in signal intensity (vertical axis) versus time (horizontal axis, t = 0 on left).
|
|
|
|---|
An FID (free induction decay) shows signal versus time, whereas an NMR spectrum shows signal versus frequency. Frequency is the inverse of time (ie. Frequency = 1/Time), so the FID can be converted to an NMR spectrum using Fourier transformation (FT).
To convert this FID graph to the the 2D NMR spectrum:
- Click the Processing button
 on the toolbar. The Processing dialog will appear as shown below: on the toolbar. The Processing dialog will appear as shown below:
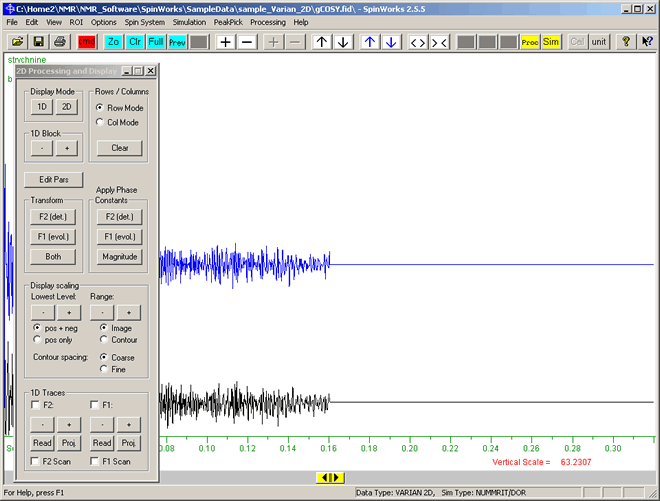
On this '2D Processing and Display' dialog box:
- Click the "Edit Pars" button.
- The "2D Processing Parameters" dialog box appears. This enables specifying a number of parameters to transform the F1 and F2 data. We will just use the current default setting. So without making any changes to the values just click the "Cancel" button at the botton of this "2D Processing Parameters" dialog. (For this Varian NMR data, the default processing parameters are based on the name of the pulse sequence, the "f1coef" parameter and the "phase" parameter.)
- Click the "Both" button (in the "Transform" group), which after a few seconds will display the transformed NMR spectrum.
- As this is magnitude only data (so no negative values), in the "Display scaling" group, click the "pos only" radio-button so that the positive results will be displayed in a greater range of colours.
- Click the "Contour" radio-button, to display the spectrum as contours.
- Close the "2D Processing Parameters" dialog box by clicking the X at the top right of this "2D Processing Parameters" dialog box.
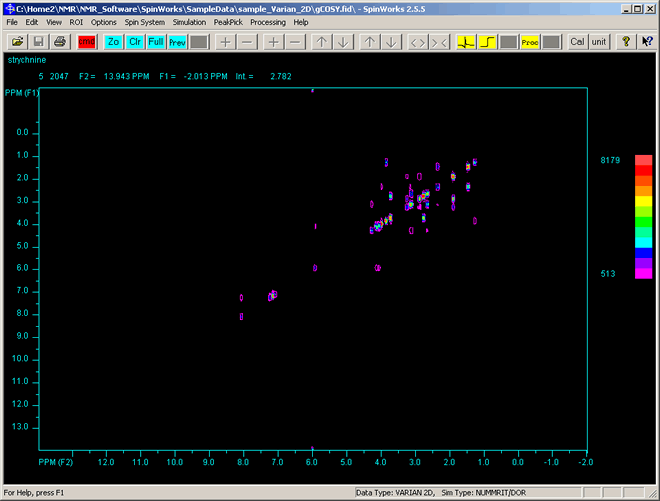
- You should now have a display of the 2D spectrum as shown below. The colours of each contour indicate the height (effectively coming out of the screen) of each peak, with peaks with a red centre being the tallest.
|
|
|
|---|
|
Moving around the 2D spectrum has some similarities to 1D.
To look at the spectrum in more detail:
- Click with left-mouse button in the NMR spectrum to display a red crosshair cursor.
- Click again at different position to display another red-crosshair cursor
- then Click the Zoom button
 on the toolbar, (or click the middle-mouse button). This will give an enlared view of the selected region similar to that shown below: on the toolbar, (or click the middle-mouse button). This will give an enlared view of the selected region similar to that shown below:
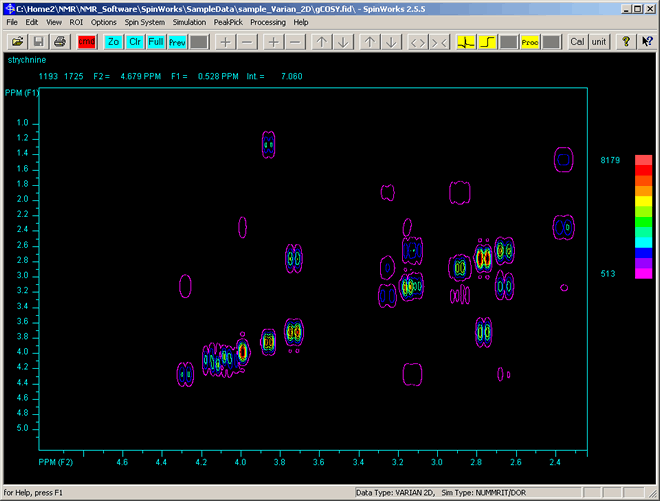
- As with 1D, clicking the left mouse button a third time will erase the red line cursors, so that you can select a different to zoom-in on.
- As with 1D, clicking the left mouse button a third time will erase the red line cursors, and then select another area to zoom.
- To return to the previous view, click the "Prev" button
 . The select another area to zoom-ion on. . The select another area to zoom-ion on.
- To return to fully zoomed out view, click the "Full" button
 . .
- As in 1D, double-clicking, or pressing the "t" key on the keyboard will turn-on or turn-off the yellow tracking cursor lines.
|
|
|
|---|
To study the correlation of peaks in this 2D COSY spectrum, it is possible to display 1D horizontal(row) or vertical (column)'cross-sections' through the 2D spectrum.
To display the 1D cross-section of the horizontal (row) at current mouse pointer position:
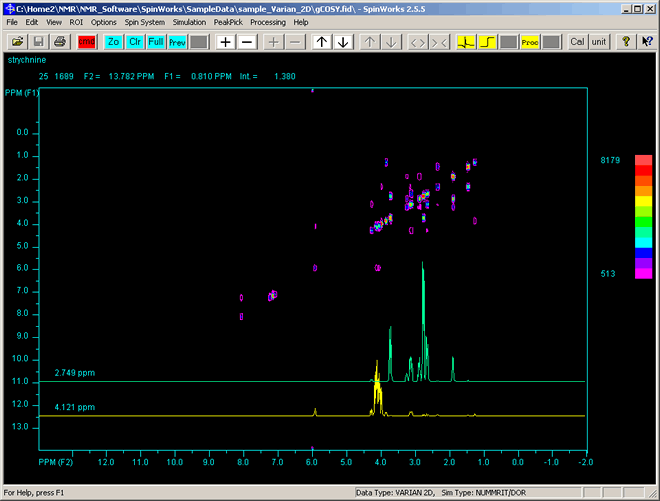
- As you move the mouse pointer, the frequency F1 (vertical-axis), F2 (horizontal-axis), and peak intensity (effectively the out-of-the-screen height) are continually in blue text updated at the top of the display.
- Click the right-mouse button, as shown in the image below, where two 1D profiles are shown at the bottom:
To display vertical (column), rather than horizontal 1D sections:
- Click the Processing button
 on the toolbar, which will display the "2D Processing and Display" dialog box. on the toolbar, which will display the "2D Processing and Display" dialog box.
- Click the "Col Mode" radio-button in the "Row/Columns" group. This will now display column cross-sections when the right mouse button is clicked over the 2D spectrum.
To clear the 1D sections:
- On the "2D Processing and Display" dialog box: Click the "Clear" button in the "Row/Columns" group.
|
|
|
Question 46: How many peaks are there at frequency F1 = 2.35 PPM ?
|
|
|
|
Your Answer: YourAnswer Mark
Correct Answer: Two single peaks and Two doublets.
Below is a 1D section throught the 2D spectrum at F1 at approximately 2.35 PPM. The yellow 1D section at the botton shows two single peaks and two doublets. The dashed-red line has been added to show where this 1D section is from.
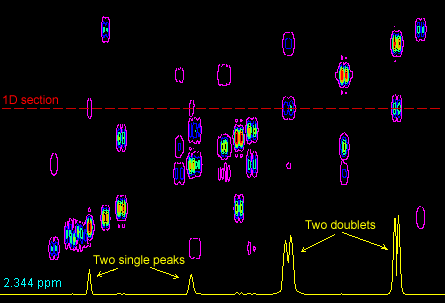
To get accurate position, watch the F1 position being continually updated at top of the screen. Zooming in to the region of interest will make selection of the correct F1 frequency easier.
|
|
|
|---|
|
The molecular structure of Strychnine is shown below.
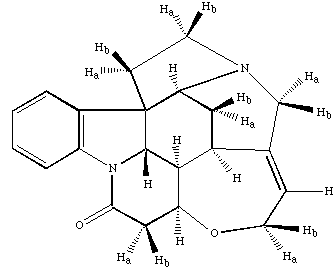
To be finished....
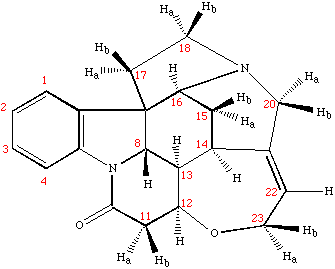
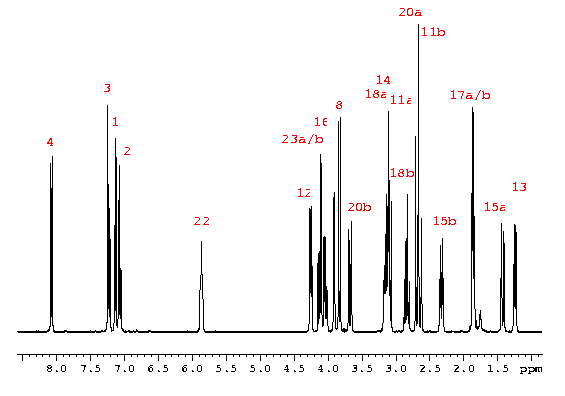
The 1H spectrum of strychnine clearly shows three different types of signals:
17 Aliphatic signals resonating between 1 and 4.5 ppm, demonstrating the possible presence of heteroatoms or ring systems
A single resonance at 5.86 ppm, probably due to an isolated double-bond system.
A four-spin aromatic system resonating in the region 7-8.1 ppm. The multiplet structure of these protons is in accordance with a lineal ABCD aromatic system.
Unambiguous assignment is achieved by analyzing the 2D COSY and the 2D 1H-13C HSQC spectra.
From the Brucker Biospin Spectral database
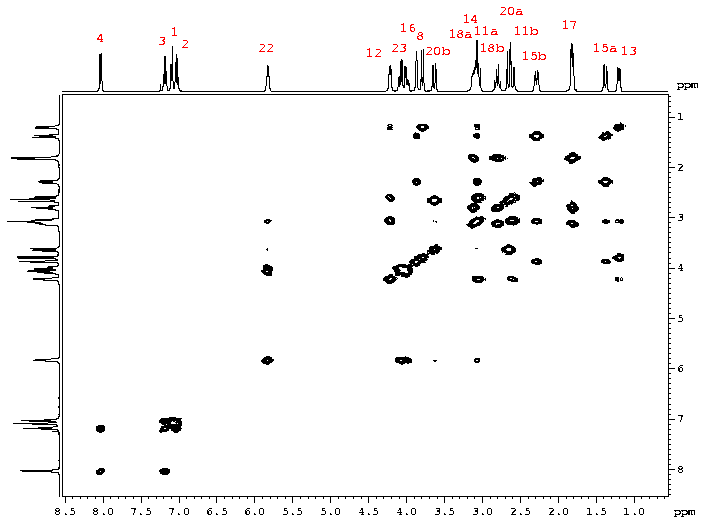
The 2D 1H-1H COSY spectrum of strychnine help us in the assignment of the conventional 1H spectrum by defining a series of some spin subsystems.
The concerted use of the 2D 1H-13C HSQC correlation spectra greatly simplifies the assignment procedure.
|
|
|
|
|---|
|
Similarily to 1D, the currently displayed region of the NMR spectrum can be printed as follows:
- Select menu option: "Edit" ⇒ "Plot Title...", and enter a suitable title, such as: "Proton 2D NMR Spectrum for Strychnine, [for John Smith]", then click the "OK" button on the "Plot Tiitle Dialog" window.
- Select menu option: "File" ⇒ "Print Preview", which should display a preview similar to that shown below:
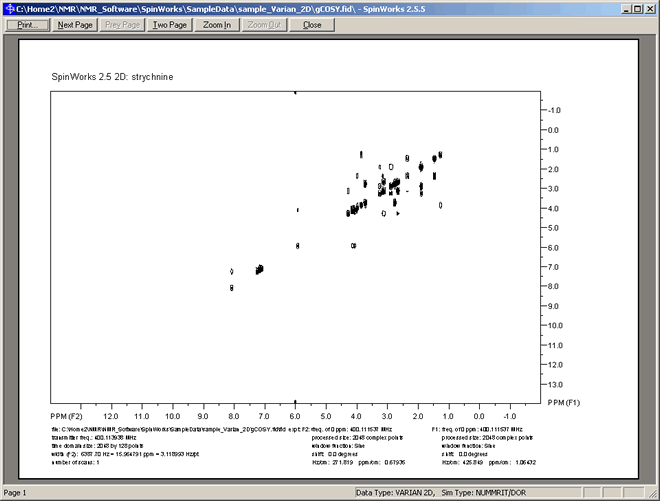
- If satisfied with the preview, then you can click the "Print" button at the top of the Preview window,
- From the "Print" dialog, select the correct printer, then click the "OK" button.
|